
Download the full Providence Report >
Located in northern Rhode Island, Providence is the state capital and home to 180,000 people, making it the most populous city in the state. Providence is one of the oldest cities in the U.S., with European colonists laying claim to the land in 1636. The “Creative Capital” and “Divine City,” Providence is a major seaport and a hub for trade, healthcare, and financial services. The Providence area includes Pawtucket, East Providence, Central Falls, Cranston, Warwick, and Woonsocket.
Before European arrival, the area was home to the Narragansett and several other smaller tribes. During The Great Swamp Massacre, which occurred in present-day Kingston, many Narragansett fled into the woods or migrated north and west. Persisting through centuries of colonial persecution, today the Narragansett constitute the largest group of native people in the state, followed by the Pequot, Wampanoag, and Nipmuc. Much of the state’s native population lives in Providence. Further setting the stage for generations of racial inequality, the region played a major role in the transatlantic slave trade. Rhode Island was one of the trade’s major geographic corners; sugar and molasses grown on Caribbean plantations were brought to Rhode Island for rum and then carried to West Africa in exchange for enslaved people. Despite having passed laws abolishing slavery in the 1600s the area heavily benefited from Southern slavery.
Racist policies and practices created deep inequities in cities like Providence. Despite being a northern state, Black people in Rhode Island faced significant racial discrimination, leading one longtime community organizer to refer to it as the “Mississippi of New England.” Racism played a role in the city’s development decisions. For example, during a 1950s highway development project, officials chose routes that favored affluent white residents and reinforced segregation. Federal policy also played a role. During the 1930s, the Roosevelt administration created the Home Owners Loan Corporation (HOLC) to lend new mortgages and refinance home mortgages that were at default during the Depression. By 1936 the agency had provided one million new mortgages and the agency owned one in five nationally. The agency developed lending risk maps in over 100 large cities, and map-makers relied on the prejudices of local loan officers, city officials, appraisers and realtors in appraising sections of the city, rating white areas of town as “desirable” and “best” for lending and areas of town where Black people, immigrants, and Jewish people lived as “hazardous,” thereby curtailing lending or issuing loans at much higher interest rates.
Many Black and immigrant families who could not obtain fair mortgages were forced into contract sales, which they paid sometimes double the actual worth of the home, could not build equity, and were more easily subject to eviction. HOLC maps knit segregation into the landscape, and today many of these historic maps align with metro-wide segregation and inequalities in homeownership. (See Providence’s HOLC map showing the “redlining” of neighborhoods throughout the city.) Today, a lower percentage of families of color in Providence own homes compared to whites, and more Black families and Latino families live near environmental contamination.
School segregation also undoubtedly determined intergenerational opportunity, even in northern cities like Providence. In 1896 the U.S. Supreme Court upheld racial segregation and for the next 60 years Jim Crow laws legally defined schools, workplaces, buses, railroad cars, and even hospitals and cemeteries as either “white only” or “colored” (Plessy v. Ferguson). In 1954, segregation was challenged in Brown v. Board of Education, and the Supreme Court held that the “separate but equal” violated the 14th Amendment. In a unanimous decision, Chief Justice, Earl Warren wrote, “In the field of public education, the doctrine of ‘separate but equal’ has no place. Separate educational facilities are inherently unequal.” Subsequently, school desegregation plans were initiated in many cities, both in the South as well as in the North, where schools were often racially segregated without the formal laws of the South. On the face of it, educational equity in Rhode Island districts may not have looked to be a problem—the state was early to outlaw school segregation (1866) and had a progressive education tradition. But, like many northern cities, due to residential patterns and district boundaries, Providence schools were segregated. In 1967, the school board ordered schools to desegregate. White-flight and demographic changes have created a district that today serves mostly students of color and low-income students while other districts in the state are whiter and wealthier.
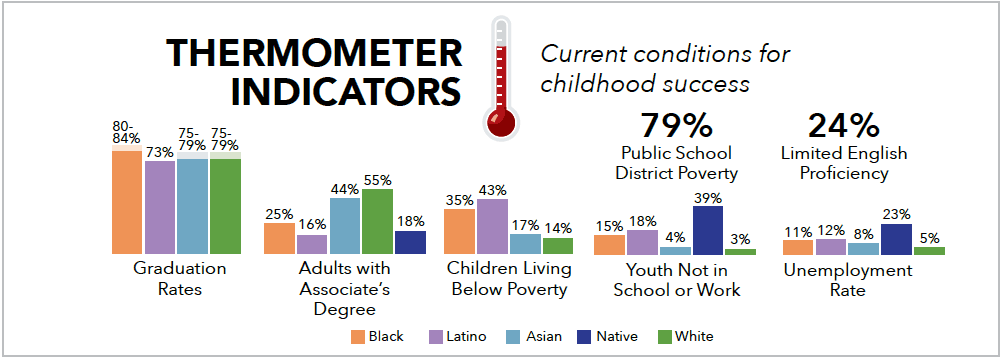
Providence operates 41 schools, including 22 elementary schools, seven middle schools 10 high schools, and two charter schools and 24,075 students, with Hispanic students accounting for 63% of the student population, Black students 17%, White students 9%, Asian students 4.9% and Native students, 1%. Almost a quarter of the students are English language learners. The rate of poverty among Black children is twice that of white children, and for Latino children, it is nearly three times that. And, a higher percentage of Black youth and Latino were out of school and unemployed.
State of Healthy Living and Learning in Providence
Overall, Providence has bright as well as challenging spots across each of the domains. When it comes to Care, Providence had the highest rate of insured youth (99%), and one of the highest rate of park access (97%) compared to other cities studied. Providence had the lowest exposure to air toxins overall (29), though there is a nearly 20 points difference between white neighborhoods and Latino and Black neighborhoods reflecting historical and ongoing policies of segregation and allowing industrial development and contamination near communities of color and away from White neighborhoods. Neighborhood stability is impacted by economic inequity – with Black and Latino households far less likely to earn living wages compared to white households.
In schools, only 38% of 3-4-year-olds were enrolled in preschool, with white youth are more than two times as likely to be enrolled. The district appears to have a culture of over-policing in schools, which especially impacts Native and Black youth. 16% of all Black students and 15% of all Native students received at least one in- or out-of-school suspension. The district also had a high number of police referrals relative to other cities, with 15% of all Native students and 5% of Black students being referred to law enforcement. While schools do appear to offer relatively high teacher salaries and have in-school support staff, there are large racial gaps in access to advanced curriculum. Providence has one Community School, established through the Rhode Island Partnership for Community Schools, a statewide alliance to mobilize resources for the Community School model. Community Schools are “public schools that partner with families and community organizations to provide well-rounded educational opportunities and supports for students’ school success.” Well-implemented Community Schools are an evidenced-based approach for supporting student success in academics and beyond, and there’s an opportunity to build on this model to improve learning environments for students in Providence, to ensure transformation system change is driven by the community of students and parents.
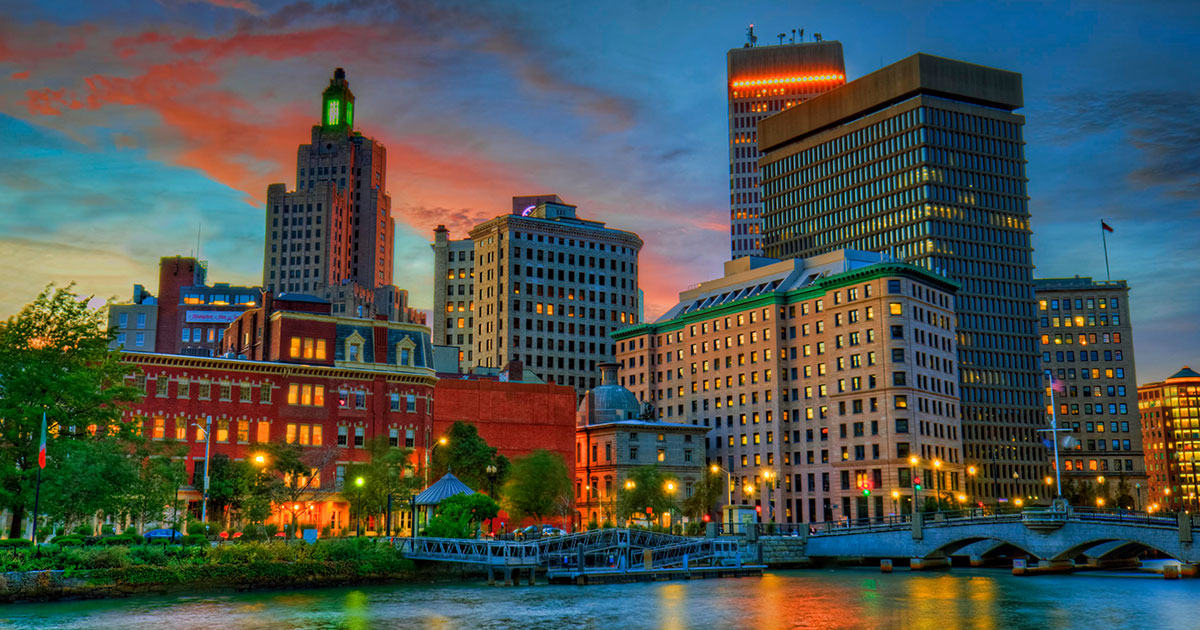
Providence skyline by Flickr user craigfildes.
For the data breakdown on every indicator, along with endnotes and references, download the PDF report below: