
Download the full Detroit Report >
Detroit, Michigan, is the largest city in the state and has a population of nearly 672,000, making it the 23rd most populous city in the U.S. Detroit has an indigenous history that predates the arrival of French and British colonizers in the 1700s and 1800s. Indigenous groups endured centuries of colonial persecution, and today Detroit has the 10th largest Native American urban population in the U.S. The city’s nicknames, “Motown” and “Motor City,” allude to major Detroit companies that have defined American culture and industry: Berry Gordy’s Motown, General Motors, Chrysler and Ford. Detroit played a major role in the Great Migration -- a term used to describe the sixty-year period during which six million Black southerners fled white terrorism of the Jim Crow south. The Great Migration began in the early 1900s and continued through 1970. Detroit was a receiving city for Black southerners, particularly those coming from Mississippi, Alabama, Tennessee, and Arkansas.
Racist policies and practices influenced the segregated landscapes of cities like Detroit. During the 1930s, the Roosevelt administration created a federal agency to lend new mortgages refinance home mortgages that were at default during the depression, called the Home Owners Loan Corporation (HOLC). By 1936 the agency had provided 1 million new mortgages and the agency owned one in five nationally. The agency developed lending risk maps in over 100 large cities, and map-makers relied on the prejudices of local loan officers, city officials, appraisers and realtors in appraising sections of the city, rating white areas of town as “desirable” and “best” for lending and areas of town where Black people, immigrants, and Jewish people lived as “hazardous,” thereby curtailing lending or issuing loans at much higher interest rates.
Many Black and immigrant families who could not obtain fair mortgages were forced into contract sales, which they paid sometimes double the actual worth of the home, could not build equity, and were more easily subject to eviction. HOLC maps solidified segregation. Developers and financiers reinforced segregated boundaries, for example, in 1940, the Federal Housing Authority denied a development project and required the developer to build a wall separating his whites-only project from nearby African American residencies, thereby reinforcing residential racial segregation. HOLC maps knit segregation into the landscape, and today many of these historic maps align with metro-wide segregation and inequalities in homeownership. (See Detroit’s HOLC map showing the “redlining” of neighborhoods throughout the city).
School segregation also undoubtedly determined intergenerational opportunity, even in Northern cities like Detroit. In 1896 the U.S. Supreme Court upheld racial segregation and for the next 60 years Jim Crow laws legally defined schools, workplaces, buses, railroad cars, and even hospitals and cemeteries as either “white only” or “colored” (Plessy v. Ferguson). In 1954, segregation was challenged in Brown v. Board of Education, and the Supreme Court held that the “separate but equal” doctrine violated the 14th Amendment. In a unanimous decision, Chief Justice, Earl Warren wrote, “In the field of public education, the doctrine of ‘separate but equal’ has no place. Separate educational facilities are inherently unequal.” Subsequently, school desegregation plans were initiated in many cities, both in the South as well as in the North, where schools were often racially segregated though without the formal laws of the South.
In 1971, the NAACP argued that rampant housing discrimination had led to segregated schools and sued the state of Michigan. The federal District Court agreed and issued an intra-district desegregation plan. The U.S. Supreme Court, however, disagreed and struck down the metro-wide plan, which included neighboring districts. Instead, they limited desegregation to the single district, a decision that protected neighboring white districts from inclusion in desegregation plans. This decision, Milliken v. Bradley (1974), has had a long-lasting impact on Detroit. Today, wide differences exist between Detroit Public Schools and other nearby districts, such as Grosse Point. Detroit is almost 98% students of color, whereas Grosse Point is 25% students of color and has a lower percentage of low-income students and higher per-pupil revenue. As a Supreme Court decision, Milliken also influenced decisions in other states; Milliken is a part of why there are significant demographic differences between neighboring school districts in many major cities. According to desegregation expert Gary Orsfield, Milliken “ended the rapid growth of desegregated schooling for Black students that had begun in the mid-1960s.”
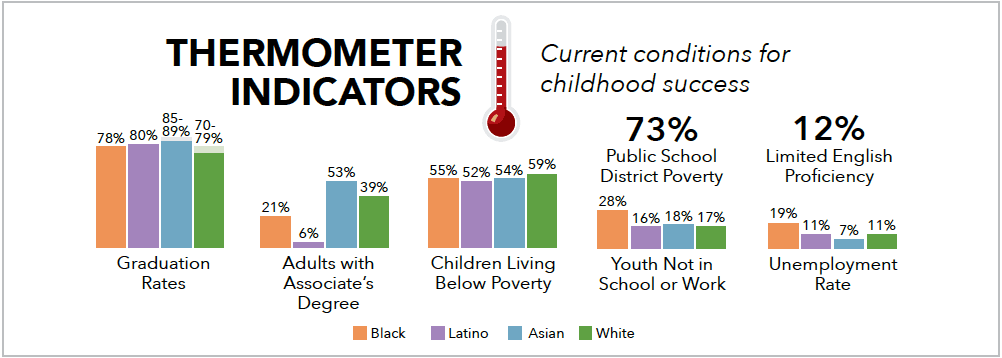
Today, Detroit Public Schools is the largest district in the state and enrolls 51,600 students in 106 schools. Black students are 75% of enrollment, white students 15%, Latino students 7% and Native students .2%. Three percent of students are English language learners. Child poverty is a concern across racial groups: 50% of children in each racial and ethnic category live in poverty and the district’s percentage of low-income children is even higher (73%). One quarter of youth were out of school and unemployed, with the highest rate among Black youth (28%).
State of Healthy Living and Learning in Detroit
Overall, Detroit has bright spots with improving Commitment to each young person’s success, though there are still major gaps in access to resources and supports, especially in community Stability and school Capacity. In the 2015-16 school year, 18% of all students had received at least one in- or out-of-school suspension, but recently Detroit school officials adopted new policies around restorative justice, and there’s strong anecdotal evidence that suspensions have been dropping significantly this school year. When it comes to health equity, Detroit had the highest rate of infants born below a healthy birth weight and the highest rate of youth mortality of cities studied. The Michigan Department of Health and Human Services has adopted an Infant Health & Equity Improvement Plan and other steps to improve health equity, though a major issue in Detroit is the lack of public health centers in the city, especially on the east side of the city. Private healthcare like Detroit Wellness Plan Medical Center has stepped in to expand Urgent Care and other services on the east side, though many health experts in Detroit are calling for resources like access to transportation and healthy food, and addressing the living conditions of individuals living in poverty as critical factors that can help ensure residents are healthy.
The Loving Cities Index highlights these broader resources that impact health in the Stability domain. Only about 40% of Black renters and around 50% of Hispanic and white renters have access to housing that is affordable for their income level. Much of this is impacted by living wages: 50% of Black households and 35% of Latino households with at least one full-time worker are not making high enough wages for their labor to live above subsistence, compared to 64% of White households. The city also has very low rates of pre-school enrollment (36%), and with 73% of public school students living in poverty, nearly all students are attending schools where the vast majority of students are living in poverty. Community organizing groups like 482Forward are working to build strong relationships and organize with residents and families to help build an education justice movement. 482Forward has worked with other community organizations, community members, and families to fight school closures and introduced legislation for greater equity and accountability, among other initiatives that empower residents through education and resources for community-driven change.
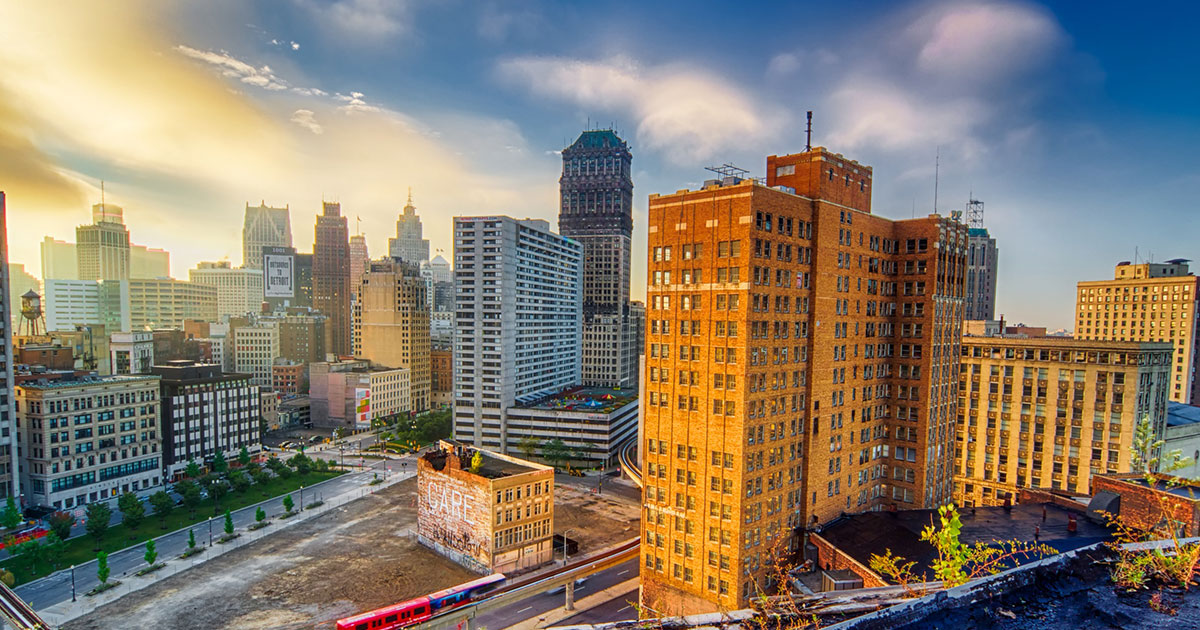
Detroit skyline by Mike Boening.
For the data breakdown on every indicator, along with endnotes and references, download the PDF report below: