Download the full St. Paul Report >
Located at the confluence of the Minnesota and Mississippi Rivers, St. Paul is the second-most populous city in the state at 308,000 people. One of two “twins,” St. Paul joins Minneapolis-St. Paul to form a major metropolitan area. Major industries in St. Paul include financial services, technology, biomedical, and retail. Historically, the city was a key transportation and trade route among Native peoples — including the Dakota, Ojibwe, Ho-Chunk, Cheyenne, Oto, Iowa and Sac & Fox indigenous peoples. St. Paul became the capital of the Minnesota territory in 1849, after which the U.S. forced many Dakota off the land. In 1956, the Indian Relocation Act defunded reservation services and relocated many indigenous peoples back into the Minneapolis-St. Paul metro area. Today the area is home to one of the most diverse and largest urban American Indian populations, over 35,000.
Racist policies and practices created deep inequities in cities like St. Paul. During the 1930s, the Roosevelt administration created the Home Owners Loan Corporation (HOLC) to lend new mortgages and refinance home mortgages that were at default during the Depression. By 1936 the agency had provided one million new mortgages and the agency owned one in five nationally. The agency developed lending risk maps in over 100 large cities and map-makers relied on the prejudices of local loan officers, city officials, appraisers and realtors in appraising sections of the city, rating white areas of town as “desirable” and “best” for lending and areas of town where Black people, immigrants, and Jewish people lived as “hazardous,” thereby curtailing lending or issuing loans at much higher interest rates. Many Black and immigrant families who could not obtain fair mortgages were forced into contract sales, which they paid sometimes double the actual worth of the home, could not build equity, and were more easily subject to eviction. HOLC maps in the Twin Cities solidified segregation and reflect currently metro-area inequalities in transportation, affordable housing, and mortgage lending. (See St. Paul’s HOLC map showing the “redlining” of neighborhoods throughout the city.)
School segregation also undoubtedly determined intergenerational opportunities, even in Northern cities. In Minnesota, Native American children were separated from their families and forced to attend segregated “Indian Boarding Schools” which sought to eliminate their culture. Fourteen of these repressive schools operated in the state until the 1970s, and although white and Black children attended school together during Minnesota’s territorial days, segregation was imposed in the 1880s. In 1896 the U.S. Supreme Court upheld racial segregation and for the next 60 years these Jim Crow laws legally defined schools, workplaces, buses, railroad cars, and even hospitals and cemeteries as either “white only” or “colored” (Plessy v. Ferguson). In 1954, segregation was challenged in Brown v. Board of Education, and the Supreme Court held that the “separate but equal” doctrine violated the 14th Amendment. In a unanimous decision, Chief Justice, Earl Warren wrote, “In the field of public education, the doctrine of ‘separate but equal’ has no place. Separate educational facilities are inherently unequal.” Subsequently, school desegregation plans were initiated in many cities, both in the South as well as in the North, where schools were often racially segregated though without the formal laws of the South. St. Paul adopted a desegregation plan in 1964, but many argue the city has still not fully lived up to this plan. Integration litigation has spanned decades and as recently as 2018 efforts continue to spur the district towards more integrated schools., Asian and Native students in particular experience high levels of racial segregation and many students of color attend high-poverty schools.
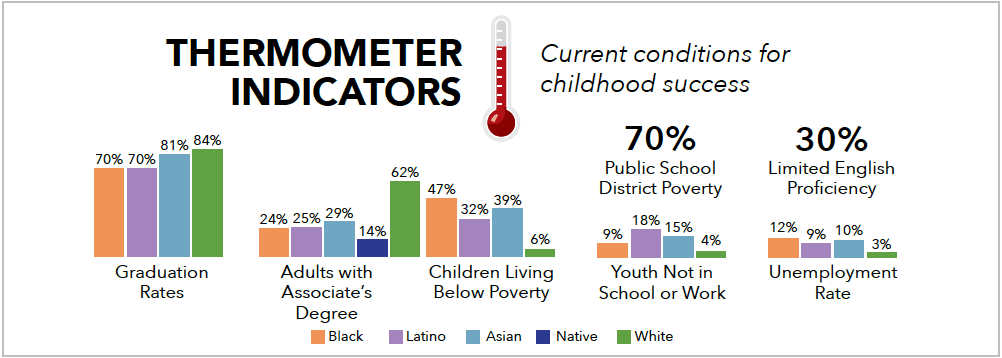
The St. Paul school district enrolls over 37,000 students and operates 56 schools, making it one of the largest in Minnesota. Asian students are 31% of the student population, Black students 27%, white students 22%, Latino students 14%, and Native students 1%. A third of the students are English language learners. The city’s percentage of low-income children is 29%, while the school district has twice that: 70%. Only 6% of white children live in poverty compared to 47% of Black children and 39% of Asian children. The percent of Latino youth out of school and unemployed is five times that of white youth, and for Asian youth, it is four times as high.
State of Healthy Living and Learning in St. Paul
Overall, St. Paul has bright and challenging spots across each of the Index domains. When it comes to Care, 98% of youth have health insurance coverage, though Latino children have lower coverage than other racial groups (91%). Nearly all residents live near public parks (98%), yet the city also has incredibly high exposure to air toxins (index score of 91 out of 100). For stability, St. Paul had the highest percentage of adults using traditional financial institutions (87%), and one of the highest rates of voter turnout (64%) compared to other cities studied. However, there are wide income disparities, with only 31% of Black households earning enough to live above subsistence, compared to 86% of white households; as well as racial gaps in access to affordable housing, with Native families facing the largest obstacles to affordable rent.
St. Paul had the lowest percentage of 3-4-year-olds enrolled in pre-school (only 32%), with a 20% difference in enrollment between Black and Latino students compared to white students. There seems to be a strong culture of over-policing students of color, with a shocking one-third of all Black and Native students receiving at least one in- or out-of-school suspension in the 2015-16 school year. Similarly, there are extremely high rates of referrals to law enforcement in the district, with 8% of Native students and 4% of Black students being referred. There are also major racial discrepancies in students enrolled in gifted and advanced curricula, with white students twice as likely to be enrolled in gifted courses and around three times as likely to be enrolled in Advanced Placement classes in high school, compared to students of color. Still, there are bright spots, with a higher experienced teaching force than many other cities (95% of teachers have more than two years of experience), and a high ratio of in-school support staff to students, including guidance counselors, instructional aides, and student support services.
St. Paul has seven full-service Community Schools through the Achievement Plus partnership with the Wilder Foundation. Community Schools are “public schools that partner with families and community organizations to provide well-rounded educational opportunities and supports for students’ school success.” Well-implemented Community Schools are an evidenced-based approach for supporting student success in academics and beyond, and building on this model can ensure the school system continues to transform to center love and equity, in a way that is driven by the community of students and parents.
St. Paul skyline by Flickr user eastendpro.
For the data breakdown on every indicator, along with endnotes and references, download the PDF report below: