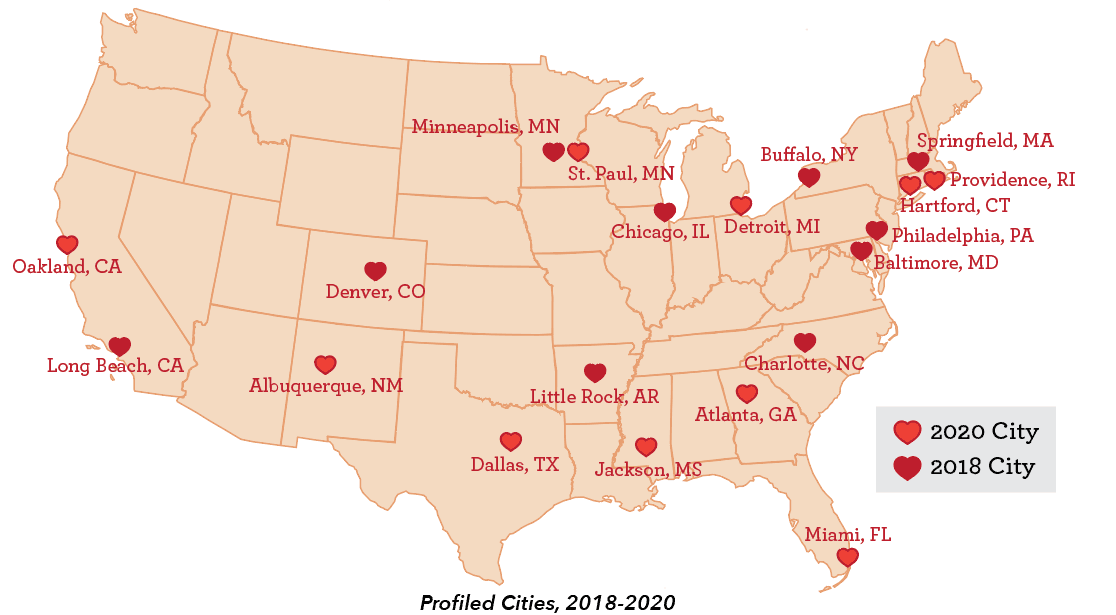
See our interactive map of all profiled cities >
Throughout American history, the policies and practices that create opportunity gaps at birth have been baked into the ecosystem of local and state systems.
It is well documented that many of these policies and practices were rooted in implicit racial bias at best, and explicit racism and hate at worst. Even today, far too often the policies and practices that govern how cities manage and resource housing, education, healthcare, transportation, workforce development, criminal justice, and civic engagement reinforce inequity in outcomes for children and families of color compared to their white peers by creating a system of barriers to success across all facets of a child’s living and learning environments. These inequities have been laid bare during the COVID-19 pandemic, where people of color are disproportionately represented in low paid front-line work facing the greatest exposure to the virus, and often are cut off from the healthcare, food services, income stability, and other resources that white, more affluent families access. And the police murder of George Floyd in Minneapolis has become a tipping point that opened a flood gate of awareness of racism, protests, and calls for systemic change, including ending the police violence faced by communities of color. Certainly, it is impossible to create loving systems without changing that fundamental underpinning.
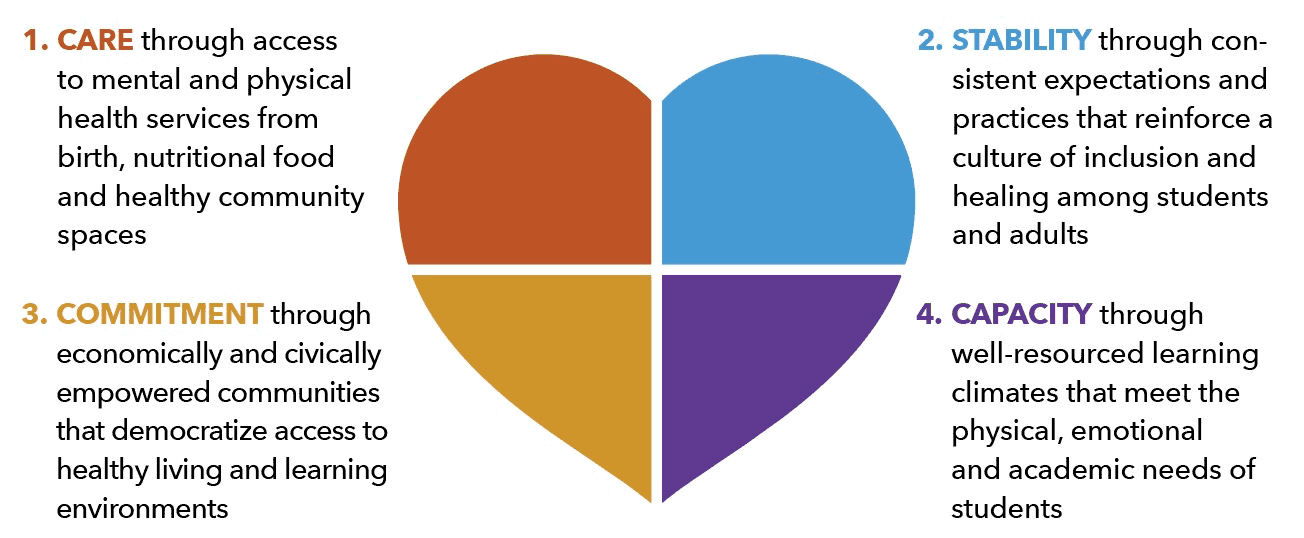
To address racial disparities in learning outcomes and provide equal opportunity, we must replace racially biased policies with practices that institutionalize love and support for all children. The Loving Cities Index is a tool and framework that provides a comprehensive analysis of local systems of love and support. The Index framework draws from the wisdom of communities and a large body of evidence-based research to identify 25 indicators that represent the supports needed for students to have the opportunity to learn and achieve academic and economic success. Each indicator reflects key city policies and practices needed to provide all children with care, stability, commitment, and capacity. The Schott Foundation believes that, by prioritizing these measures, over time cities can significantly accelerate educational outcomes, particularly for students of color.
The Schott Foundation and research partners have studied 20 cities using the Loving Cities Index to assess the systems of love and support in place at the local and state levels to provide children with an opportunity to learn. Ten cities are profiled in this 2020 Loving Cities Index Report, and ten were previously profiled in the 2018 report.
For each city, researchers collected publicly available data at the local level collected consistently across the country and scored the city against 25 indicators of love and support. For each indicator, a city can earn up to three points for levels of access to that support, and when data disaggregated by race and ethnicity is available, cities can earn up to three more points for equity in access across racial groups. We recognize that opportunity gaps are impacted by more than just race/ethnicity, and ideally city, state, and federal policymakers should be collecting and analyzing data by gender, sexuality, and other intersectional identities that tell a deeper story of access and equity. Unfortunately, much of the national datasets that we used for this report did not include data disaggregated by both race and gender, and oftentimes localities are not collecting and reporting data at this level. And sexuality is often missing completely from disaggregated data. Organizing to require states and localities to disaggregate more data by race, ethnicity, gender and sexual orientation is an essential part of addressing opportunity gaps which remain hidden because of data gaps. Simply stated, data gaps are too often platforms for opportunity gaps.
We consistently see massive gaps in access to resources in each city, reflecting major opportunity gaps based on race. While in each city there may be some policies and practices in place to provide access to some critical supports, every city studied has significant gaps in delivering the full system of supports that were needed for all children to thrive. We have developed profiles for each city studied. Within each city profile, we provide historical context for racial inequities, highlighting the policies rooted in racism and hate that have governed access to education, housing, fair wages, healthcare, public spaces and other critical resources and supports, based on race; and highlight the persistent racial inequities in access that exist in our communities today, and the anti-racist policies that can be instituted to address them.
To achieve education justice, we must support healing in communities harmed by a long history of racist policies that persist to this day and replace systems of oppression with systems that institutionalize love and support. We hope the Loving Cities Index profile can be a tool for local community advocates that work tirelessly to advance an agenda of love and support for all children. We hope that city and state leaders will work in partnership with communities of color to truly meet the promise of “equity and justice for all.”
Thermometer vs. Thermostat
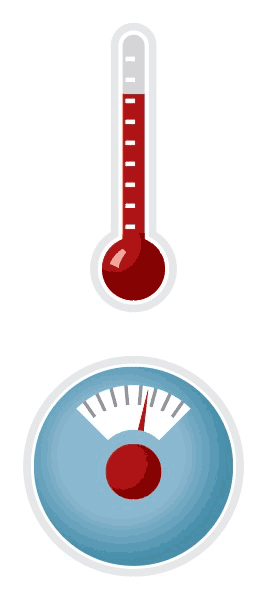 When we look at a thermometer, we can see what the current temperature in the room is, but we have no way of adjusting it. A thermostat is the tool that can change the temperature; “moving the dial” on the thermostat if the room is too cold will increase the flow of heat to the room until the temperature reaches the desired level.
As such, the indicators measured in the Loving Cities Index are what we call “thermostat” support indicators, and reflect a shift away from focusing on “thermometer” indicators. “Thermometer” indicators are community level outcome indicators like high school graduation, post-secondary attainment, poverty and unemployment, which are important to look at, but can be difficult to interpret or move the needle on because they only provide a static snapshot of the existing community climate. “Thermostat” support indicators provide insight on the various inputs or supports that are available to manipulate or change the existing community-level climate or outcomes. Thermostat indicators are more active and provide clear focus for creating positive change that will ultimately impact the “thermometer” measures of outcomes. The Loving Cities Index shifts focus to “thermostat” indicators to help communities set clear goals and track progress.


