Download the full Hartford Report >
Located in north-central Connecticut, Hartford is the capital and the fourth largest city in the state. Nicknamed “New England’s rising star,” Hartford was settled by Dutch and English traders in the 1600s and is one of the nation’s oldest cities. The city of Hartford is surrounded by inner-ring suburbs such as East and West Hartford and outer-ring suburbs such as Farmington, and Andover that have historical, economic, and social ties with the city. Since the 1700s, insurance has and continues to be a major industry. The area was originally home to many Native American tribes, many of who were killed or forced into slavery or servitude following battles with the British over land and resources. Today, the Mohegan and Mashantucket Pequot remain sovereign nations in the region.
Like other major urban cities, racist housing policies and practices intersected with schooling dynamics to form intensely segregated neighborhoods and schools in Hartford. During the 1930s, the Roosevelt administration created the Home Owners Loan Corporation (HOLC) to lend new mortgages refinance home mortgages that were at default during the Depression. By 1936 the agency had provided one million new mortgages and the agency owned one in five nationally. The agency developed lending risk maps in over 100 large cities and map-makers relied on the prejudices of local loan officers, city officials, appraisers and realtors in appraising sections of the city, rating white areas of town as “desirable” and “best” for lending and areas of town where Black people, immigrants, and Jewish people lived as “hazardous,” thereby curtailing lending or issuing loans at much higher interest rates. Many Black and immigrant families who could not obtain fair mortgages were forced into contract sales, which they paid sometimes double the actual worth of the home, could not build equity, and were more easily subject to eviction. HOLC maps knit segregation into the landscape, and today many of these historic maps align with metro-wide segregation and inequalities in homeownership. (See Hartford’s HOLC map showing the “redlining” of neighborhoods throughout the city.)
School segregation also influenced intergenerational opportunities in places like Hartford, even as a northern city. In 1896, the U.S. Supreme Court upheld racial segregation and for the next 60 years Jim Crow laws legally defined schools, workplaces, buses, railroad cars, and even hospitals and cemeteries as either “white only” or “colored” (Plessy v. Ferguson). In 1954, segregation was challenged in Brown v. Board of Education, and the U.S. Supreme Court held that the “separate but equal” doctrine violated the 14th Amendment. In a unanimous decision, Chief Justice, Earl Warren wrote, “In the field of public education, the doctrine of ‘separate but equal’ has no place. Separate educational facilities are inherently unequal.” Subsequently, school desegregation plans were initiated in many cities, both in the South as well as in the North, where schools were often racially segregated even without formal laws of the South.
Hartford’s segregated housing contributed to segregated schools and in 1989 NAACP counsel, representing a multiracial group of Hartford families used this as the basis in Sheff v. O’Neill for challenging the district’s racial and economic segregation. They argued that Black, Latino, and white students in Hartford were being denied an education equal to their suburban counterparts. The State Supreme Court agreed and encouraged the state government to prioritize integration. Magnet, choice, and inter-district exchange programs spurred some integration gains. However, a 2015 analysis found that over half of Hartford schools were intensely segregated (90-100% minority) and that one-eighth were considered apartheid schools (99-100% students of color). Another 2015 analysis found that housing costs and zoning issues were still an obstacle to educational access. , Elementary schools to the north of the district tend to have more Black and Latino students, compared to those in the southern part of the district that have more whites. Meanwhile, Hartford borders South Windsor, an affluent and predominantly white school district that enrolls only 4,000 students and where the per-pupil revenue is $15,206 compared to Hartford’s $3,785, making the line between the two among the nation’s most “segregated borders.” West Hartford is another nearby district with opposite enrollment demographics. At the beginning of 2020, Sheff v. O’Neil was finally settled and an agreement was reached for resources to aid integration through June 2022.
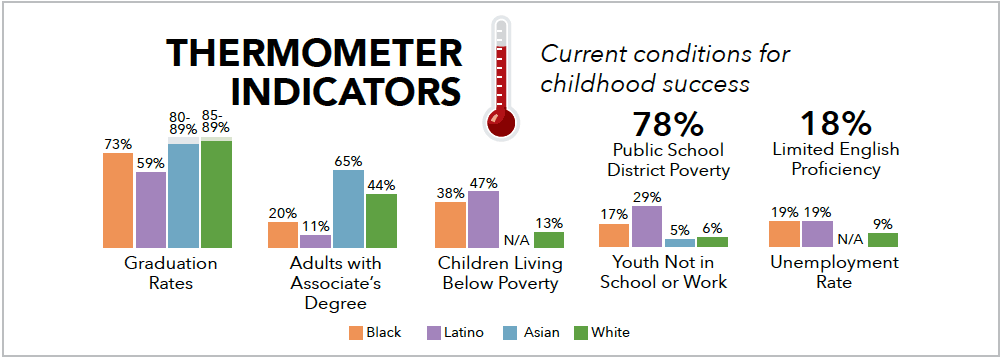
Hartford Public Schools is the largest district in the state and serves approximately 44 schools. Enrollment demographics are 53% Latino, 30% Black, 11% white, and 4% Asian. The percent of children living in poverty is 42% in the city, but 75% among children in the district schools. Higher percentages of children of color live in poverty compared to white children and youth out of school and unemployment rates were highest for Black youth and Latino youth.
State of Healthy Living and Learning in Hartford
Overall, Hartford has bright spots in access to Care, with the high rates of grocery stores in low-income neighborhoods, 96% of youth covered by health insurance, access to parks, and a decent investment in social workers in schools. While overall Hartford has relatively low rates of exposure to air toxins compared to other cities, there is also one of the greatest gaps in air quality between Black and Latino neighborhoods and white neighborhoods. Hartford also had among the lowest rate of youth mortality, with similarly low mortality rates when disaggregated by race.
There are opportunities to address neighborhood Stability, as well as Commitment and Capacity in schools. Hartford had one of the lowest levels of households with at least one full-time worker earning high enough wages to live above subsistence compared to the other cities studied. Only 52% of households earned livable wages, with only 41% of Latino households earning livable wages compared to 58% of white households. In schools, Hartford had the highest overall suspension rate of all cities (19%), with over 25% of Black students and nearly 20% of Latino students receiving at least 1 in- or out-of-school suspension. There do not seem to be any steps being taken to adopt restorative justice practices, highlighting a culture of over-policing children of color that creates a racially oppressive school-to-prison pipeline.
The Hartford Partnership for Student Success has collaborated for over a decade to implement Community Schools in the city. Community schools are “public schools that partner with families and community organizations to provide well-rounded educational opportunities and supports for students’ school success.” Well-implemented Community Schools are an evidenced-based approach for supporting student success in academics and beyond. Currently, the district has seven Community Schools and has seen numerous positive impacts, with a goal of all schools being community schools by 2022.
Hartford skyline by Flickr user michelgagnon.
For the data breakdown on every indicator, along with endnotes and references, download the PDF report below: