Download the full Miami Report >
Situated in South Florida, between the Everglades and Biscayne Bay, Miami is the sixth most densely populated city in the U.S., with approx. 471,000 people. Today’s major industries include finance, commerce, media, and international trade. Nicknamed the “magic city” and “the gateway to the Americas,” Miami was officially incorporated in 1896. Before European contact, Historically, Miami was home to many indigenous groups, such as the Seminoles, a coalition of Northern Florida and Southern Georgia natives that banded together to fight European invaders, including the Creek, Miccosukee, Hitchiti, and Oconee tribes. Between 1800 and 1850, the U.S. military waged war against the Seminoles, who fought to stay on their land. Today, many of the descendants of this now united sovereign nation remain in and beyond Miami.
Additional layers of racist policies and practices were baked into Miami’s founding. In 1896, officials restricted Black households to an area of the city called “Colored Town” known today as Overtown. Restrictive racial covenants in Miami also expressly discriminated against Jewish people. For example, the “Father of Miami Beach,” Carl Fisher, refused to sell property to Jewish people and deed restrictions forced Jews to live south of Fifth Street. According to local papers, a 1930s Miami Beach hotel promised vacation-goers, “always a view, never a Jew.” In 1936 Miami officials enacted Ordinance 457, which required seasonal workers and domestic servants, many of whom were Black, to register with the police department and to carry I.D. cards at all times. For decades, Black residents were prohibited from entering nearby affluent areas like Miami Beach and Coral Gables.
Another major influence creating segregated landscapes in major cities like Miami was the Home Owners Loan Corporation (HOLC), created by the Roosevelt administration during the 1930s to lend new mortgages and refinance home mortgages that were at default during the Depression. By 1936 the agency had provided one million new mortgages and the agency owned one in five nationally. The agency developed lending risk maps in over 100 large cities, and map-makers relied on the prejudices of local loan officers, city officials, appraisers and realtors in appraising sections of the city, rating white areas of town as “desirable” and “best” for lending and areas of town where Black people, immigrants, and Jewish people lived as “hazardous,” thereby curtailing lending or issuing loans at much higher interest rates. Many Black and immigrant families who could not obtain fair mortgages were forced into contract sales, which they paid sometimes double the actual worth of the home, could not build equity, and were more easily subject to eviction. HOLC maps knit segregation into the landscape, and today many of these historic maps align with metro-wide segregation and inequalities in homeownership. (See Miami’s HOLC map showing the “redlining” of neighborhoods throughout the city.) By the 1940s Miami had become one of the most segregated cities in the U.S., a status that continues today.,
School segregation also determined intergenerational opportunity in Miami. In 1896, the U.S. Supreme Court upheld racial segregation and for the next 60 years Jim Crow laws legally defined schools, workplaces, buses, railroad cars, and even hospitals and cemeteries as either “white only” or “colored” (Plessy v. Ferguson). In 1954, segregation was challenged in Brown v. Board of Education, and the Supreme Court held that the “separate but equal” doctrine violated the 14th Amendment. In a unanimous decision, Chief Justice, Earl Warren wrote, “In the field of public education, the doctrine of ‘separate but equal’ has no place. Separate educational facilities are inherently unequal.”
Subsequently, school desegregation plans were initiated in many cities, both in the South as well as in the North, where schools were often racially segregated without formal laws. Miami evaded integration until 1959 when Black parents filed an integration lawsuit against the school district, which anti-integration activists fought. Miami’s desegregation plan ended in 2001 and since then the percentage of schools considered racially isolated (85% or more of one racial group) has increased, caused in part by increases in Hispanic and Caribbean Black populations and the out-migration of whites to private schools and housing developments north of Miami in Broward County. Currently, Miami is among the most segregated districts released from desegregation plans. Across the district, the average Black student attends a school where 64% of their peers are Black and the average Latino student attends a school where nearly 80% of their peers are Latino. Orchard Villa Elementary, the first of Miami’s all-white schools to be integrated back in 1959, today enrolls only two white students.
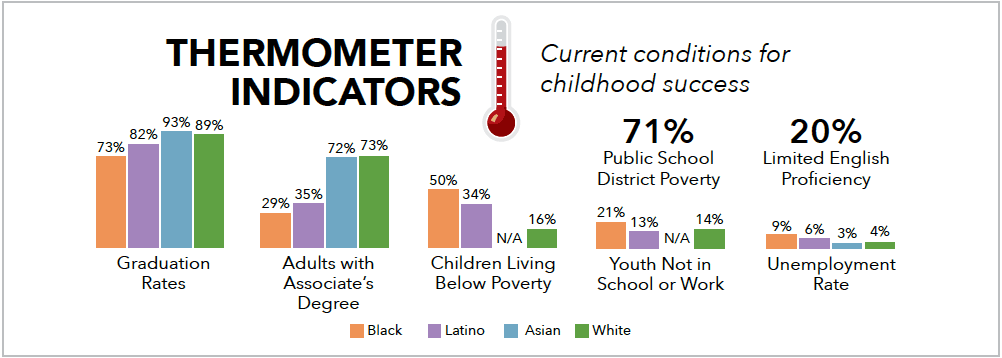
Miami-Dade is the third-largest school district in the nation and the largest in the state, serving 358,179 students in 476 schools, including 134 charters and 342 traditional schools. Latino students were 69% of the student population, Black students 22%, white students 7.3%, Asian students 1%, and Native students .1%. One-fifth of students are English language learners. Over a third of children live in poverty, but the rates for Latino and Black children are two and three times that of white children. The percentage of youth out of school and unemployed is highest for Black youth (20%). Communities in Schools works in seven Miami-Dade schools, providing a site-based coordinator to implement a model of integrated student supports.
State of Healthy Living and Learning in Miami
Overall, Miami has bright spots in Commitment to every child’s success, with a relatively high pre-school enrollment (65%), low suspension rates, and no reported pre-school suspensions or K-12 expulsions. Still, there were a high number of referrals of students to law enforcement (617 in the school year 2015-16), and those referrals were disproportionately made for Black (44%) and Hispanic students (47%). When it comes to health equity measures of Care, Miami had the lowest rate of insured youth (93%), and racial gaps in infants born with low birth weight, an indicator of inequity in access to maternal healthcare and discrimination of healthcare workers towards Black women. In schools, there appears to be a dearth of psychologists and social workers available to students.
There are also opportunities for improving policies and practices that strengthen neighborhood Stability. Like many other cities, Miami has considerable racial gaps in livable wages, with only about half of Black and Latino households working full-time earning enough for their labor to live above subsistence, compared to 88% of white households. This, combined with rising housing costs, resulted in Miami having the lowest access to affordable housing of cities studied – only 37% of renters pay housing costs that less than 30% of their total income. Teachers are likely part of this population struggling with low wages and unaffordable housing – average teacher salaries are $35,000, only 61% of the minimum living wage needed to live above subsistence. There is also considerable economic and racial segregation in Miami public schools, with the majority of Black and Latino students attending schools where more than 75% of the student body are living in poverty, compared to White students. Similarly, there are major racial gaps in student enrollment in advanced placement courses that prepare students for college and career readiness.
Miami skyline by Flickr user aerialcamera.
For the data breakdown on every indicator, along with endnotes and references, download the PDF report below: